Most dental marketing budget advice starts with a percentage of revenue. That number is a reasonable first guess and a weak final answer, because it ignores the two things that decide whether the money works: what a new patient is worth to your practice, and whether your schedule can absorb more of them.
Published practitioner guidance puts typical dental marketing spend at roughly 4% to 7% of annual collections. Mature practices tend to sit nearer 3% to 5%, while practices in growth or ramp-up mode land between 5% and 12% or more. For a practice collecting $1.5 million a year, that spans about $45,000 to $180,000. The sections below show how to choose a point inside that range and divide it across channels for 2027.
What percent of revenue should a dental practice spend on marketing?
There is no official benchmark, and it helps to be clear about that. The figures that circulate come from agency and consultant guidance, not from a controlled study. One dental practice consultancy, Bulletproof, describes three bands, and a dental marketing agency, Best Results Dental Marketing, cites 4% to 7% overall. Applied to a practice with $1.5 million in yearly collections, the bands look like this:
| Practice stage | Share of collections | Per year | Per month |
|---|---|---|---|
| Mature, defending its position | 3% to 5% | $45,000 to $75,000 | $3,750 to $6,250 |
| Growth mode (new operatories, associate, more new patients) | 5% to 8% | $75,000 to $120,000 | $6,250 to $10,000 |
| Startup or acquisition ramp-up | 8% to 12%+ | $120,000 to $180,000 | $10,000 to $15,000 |
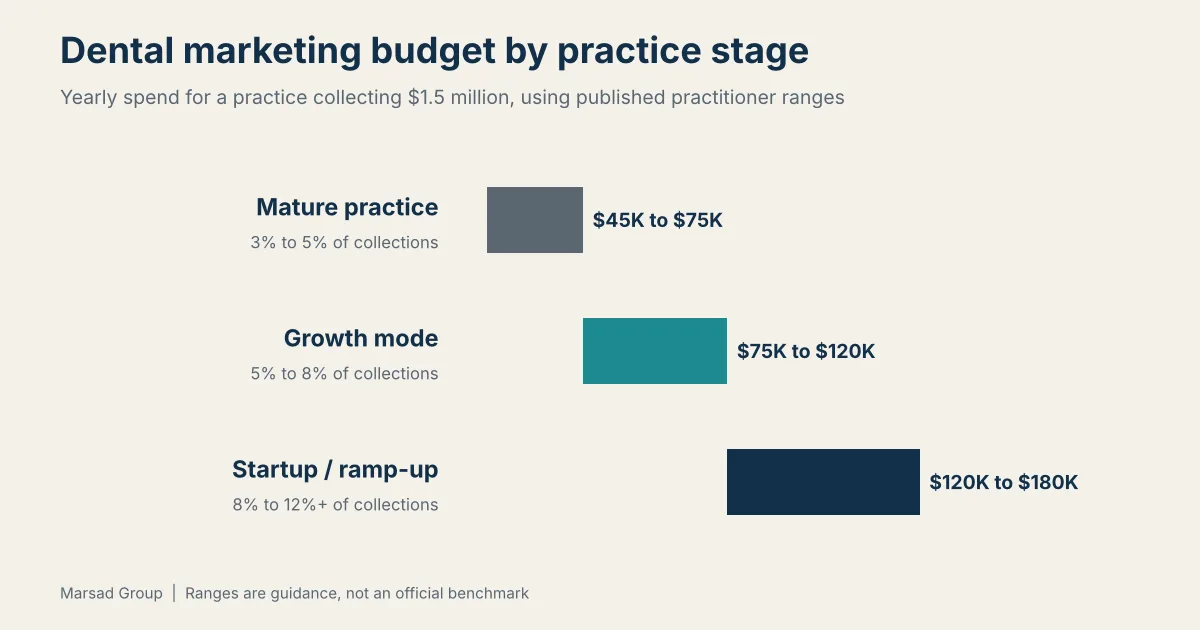
Our view: treat this table as a ceiling check. If your plan lands far above the band for your stage, you should be able to explain why. If it lands inside the band, you still have not proven the spend is right, because the percentage says nothing about return.
Start from what a new patient is worth
A better starting point is the most you can afford to pay for one new patient. The formula is short:
Maximum cost per new patient = first-year value of a new patient × the share of that value you keep after delivering the care.
Published estimates of first-year value vary. Best Results Dental Marketing cites $700 to $1,250, and Bulletproof uses $1,000 or more in first-year production. Take $1,000. Production is not profit, so assume you keep 40% after clinical costs, staff time and supplies. That 40% is an assumption for this example, and you should replace it with your own contribution margin. The ceiling is then $400 per new patient.
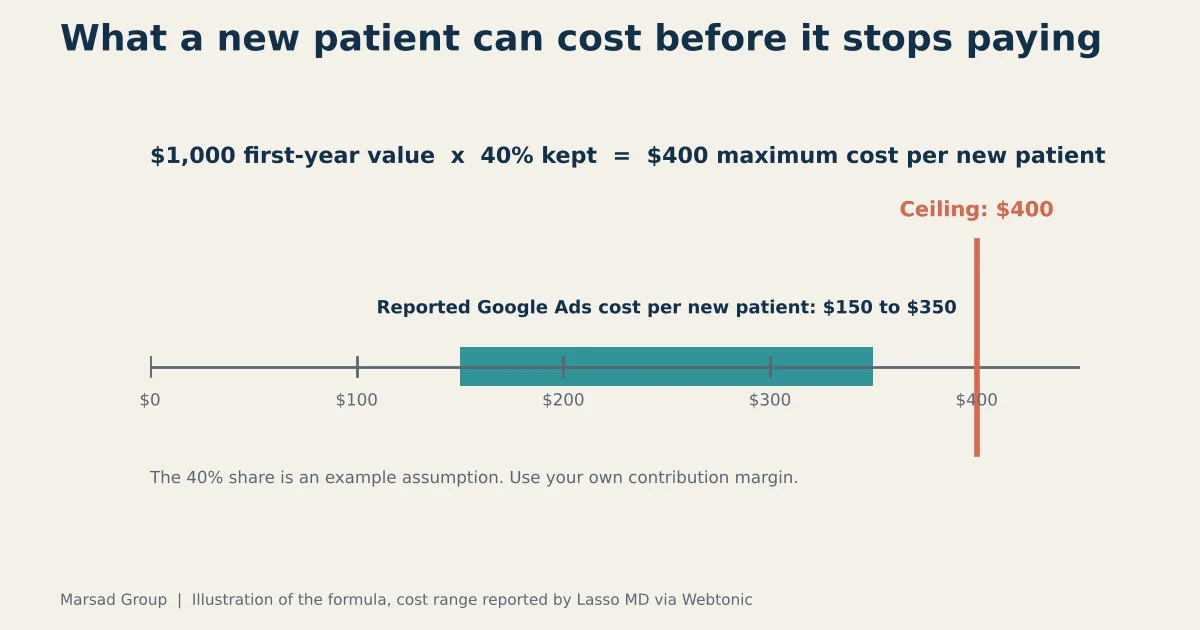
Now compare that ceiling with what channels cost. A 2026 roundup of dental Google Ads data reports a cost per new patient of $150 to $350 from Google Ads, citing Lasso MD. Those numbers fit under a $400 ceiling, but only for service lines that behave like general dentistry. The same roundup lists click costs of $3 to $8 for general dentistry, $5 to $12 for cosmetic work, and $12 to $25 or more for implants. An implant campaign can blow through the ceiling that a hygiene-recall campaign never touches.
Turn the ceiling into a patient target
Divide the annual budget by your expected blended cost per new patient. A $96,000 budget at $300 per patient implies roughly 320 new patients a year, or about 27 a month. Now check the schedule. If your doctors and hygienists are already booked three weeks out, 27 extra patients a month will not produce revenue; they will produce a longer wait and more cancellations. In that case the right 2027 move is a flat or lower budget aimed at higher-value procedures, not a bigger one.
Your front desk is a budget line too
The same roundup reports an average dental cost per lead of $83.93 on Google Ads, from WordStream data. Set that beside the $150 to $350 cost per new patient and you can back out an implied lead-to-patient rate of roughly 24% to 56%. The two figures come from different sources and may define a “lead” differently, so treat the range as a rough signal. Even so, the spread matters: with identical ad spend and identical cost per lead, cost per new patient can differ by more than double depending on how fast and how well calls and form requests are handled. Before raising an ad budget, measure how many inquiries become booked first visits.
A worked monthly split for a growth-stage practice
We would divide $8,000 a month this way, about $96,000 a year or 6.4% of the $1.5 million example, for a practice in growth mode. It is a starting allocation we are proposing, not an industry benchmark, and the right split depends on your market and service mix.
| Line item | Share | Per month | What it covers |
|---|---|---|---|
| Paid search | 30% | $2,400 | Google Ads and Local Services Ads for high-intent searches |
| Local SEO and content | 25% | $2,000 | Service pages, Google Business Profile upkeep, local citations |
| Social and video | 10% | $800 | Short-form video, organic social, a small paid boost |
| Website and booking | 10% | $800 | Speed, mobile layout, online scheduling, call tracking |
| Reviews and reputation | 8% | $640 | Review requests, response workflow, monitoring |
| Recall and reactivation | 7% | $560 | Overdue-patient outreach, referral prompts, email and text |
| AI search visibility | 5% | $400 | Entity consistency, clear service and location content |
| Compliant tracking | 5% | $400 | Vendors that will sign a BAA, server-side measurement |
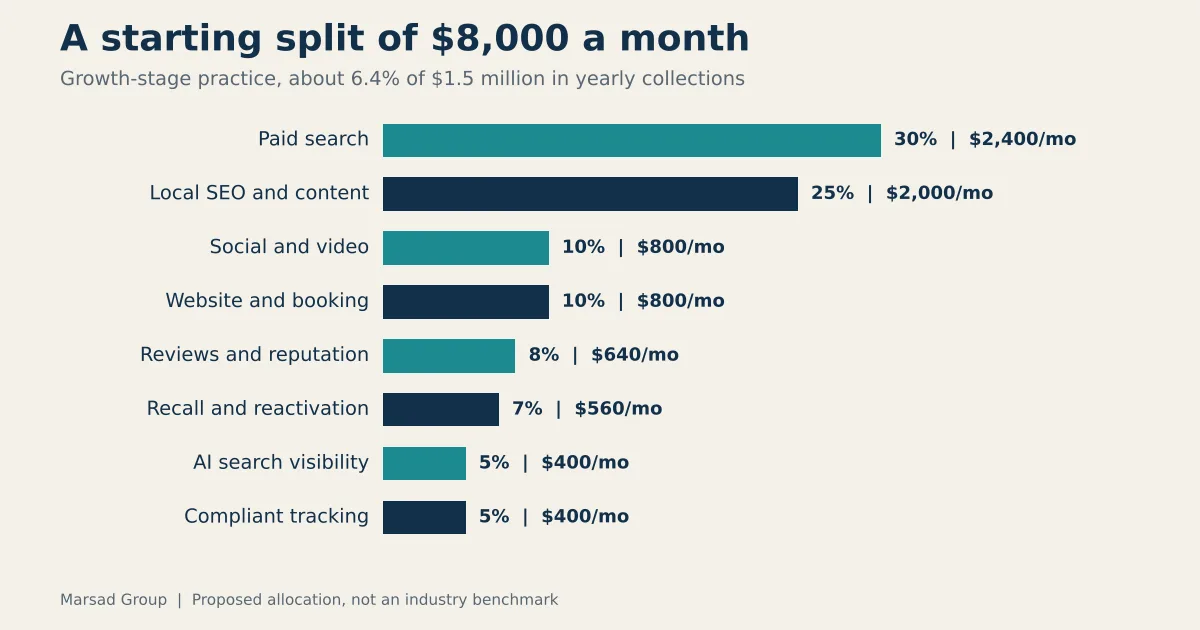
The 30% for paid search sits inside the 25% to 40% of digital spend that Best Results Dental Marketing suggests for online ads. If you also spend on print, mailers or sponsorships, that source suggests keeping traditional marketing near 20% of the total, and the table above would shrink proportionally.
One line deserves a defense: recall and reactivation. It is the cheapest source of booked visits in most practices because the patients already know you. A practice that cuts it to fund more ads is usually paying more for a worse patient.
Line items most budget guides leave out in 2026
Compliant measurement. If your site shares patient-related data with ad or analytics platforms, your tracking setup is part of your marketing cost. The U.S. Department of Health and Human Services publishes guidance on online tracking technologies and the HIPAA Privacy Rule, and a federal court set aside part of that guidance in 2024, so confirm the current position with your compliance counsel. Our breakdown of HIPAA compliant marketing tracking covers what a practice needs to have in place. Budget for tools that offer a business associate agreement, because the cheaper default setup is often the risky one.
AI search visibility. Patients increasingly ask chatbots and AI search features where to find a dentist. Visibility there depends on clear, consistent information about your practice across your site and profiles, which overlaps with good local SEO. Our GEO guide for medical practices explains the mechanics. A small dedicated line, around 5%, is enough to keep that work from being nobody’s job.
A test reserve. Ad platforms changed their healthcare rules several times this year, and a channel that works in January can be restricted by June. Our notes on Meta ads restrictions for practices and Local Services Ads for dentists show how quickly the ground moves. Hold back 10% to 15% of the annual budget, our own rule of thumb rather than a published standard, so you can shift money without reopening the whole plan.
How to build the 2027 budget during Q4
- Pull 12 months of new patients by source. Use your practice management system, not ad platform dashboards, so you count booked and attended first visits instead of clicks.
- Calculate cost per new patient for each channel. Divide each channel’s spend by the attended new patients it produced. Keep implants, orthodontics and general dentistry separate.
- Calculate your ceiling. Use the formula above with your own first-year value and margin.
- Check capacity. Look at how far out the doctor and hygiene schedules are booked and where the real bottleneck sits.
- Choose a percentage band for your stage. Use the table as a sanity check against the bottom-up numbers.
- Set the reserve and the review dates. Schedule a quarterly review now, and decide in advance what result moves money out of a channel.
- Use the weeks left in the year. Patients with unused insurance benefits are an easy audience before December 31, and a year-end dental benefits campaign can also tell you how well your recall list responds.
Budget mistakes that waste the most money
Judging channels by leads. A campaign that produces many calls from people who never book is cheaper per lead and costlier per patient. Count attended first visits.
Starving the free-looking channels. Reviews, recall and your Google Business Profile cost little in media but need staff time and process. Practices that treat them as free tend to run them badly.
Spreading money across everything. Eight channels at $400 each rarely reach the volume needed to learn anything. Fund fewer channels properly and add one at a time. Our practical guide to online marketing for dentists covers the order in which most practices should add them.
Raising spend before fixing intake. If calls go to voicemail or web forms wait a day for a reply, extra traffic mostly buys disappointment.
Setting the number once. A yearly budget with no quarterly review locks in whatever you guessed last October.
Dental marketing budget FAQ
How much should a dental practice spend on marketing?
Most published guidance lands between 4% and 7% of annual collections, with mature practices nearer 3% to 5% and growth or startup practices between 5% and 12%. These are practitioner ranges, not official benchmarks. Use them to sanity-check a plan built from your cost per new patient and available chair time.
What does it cost to acquire a new dental patient?
One 2026 roundup of dental advertising data cites $150 to $350 per new patient from Google Ads, though costs rise for implants and cosmetic work. Your real figure depends on your market, your service mix and how well inquiries convert. Calculate it yourself from attended first visits by source.
Should a new dental practice spend more than an established one?
Usually, yes. Guidance for practices in startup or acquisition ramp-up runs 8% to 12% or more of collections, because the schedule has empty chair time and no patient base to recall. Established practices with full schedules can often hold spend closer to 3% to 5% and focus on retention.
How should I split my budget between SEO, Google Ads and reviews?
A reasonable starting point for a growth-stage practice is about 30% to paid search, 25% to local SEO and content, and 8% to reviews, with the rest across website, recall, social, AI search visibility and compliant tracking. Adjust after one quarter of attended-patient data by source.
When should a dental practice set its marketing budget for next year?
Set it in Q4, after you have a full year of new-patient data by source. October through December gives time to calculate cost per new patient, check capacity, and confirm tracking is compliant before January. Build in a quarterly review so the plan can change when channel results or ad rules change.
A budget is a set of assumptions about patient value, close rate and capacity. Write those three numbers at the top of the spreadsheet, and the percentage at the bottom becomes something you can defend instead of a figure borrowed from another practice.